Non-safepoint profiling for better fidelity
At QCon 2015 last November, we saw this presentation by Nitsan Wakart talking about the limitations of sampling profilers (most of them). The basic idea is that the normal JVM profiling API can only sample at “safepoints” which are basically method calls, loops and certain other places where the VM is halted while it records its state. Because of hotspot optimization and code inlining, it is quite common that method calls become invisible to the profiler and the code locations reported by the profiler are only approximate. This makes their results difficult and sometimes misleading to interpret.
It turns out that the latest versions of Oracle’s JVM have the ability to do non-safepoint profiling, with the right flags enabled.
-XX:+UnlockCommercialFeatures -XX:+FlightRecorder -XX:+UnlockDiagnosticVMOptions -XX:+DebugNonSafepoints
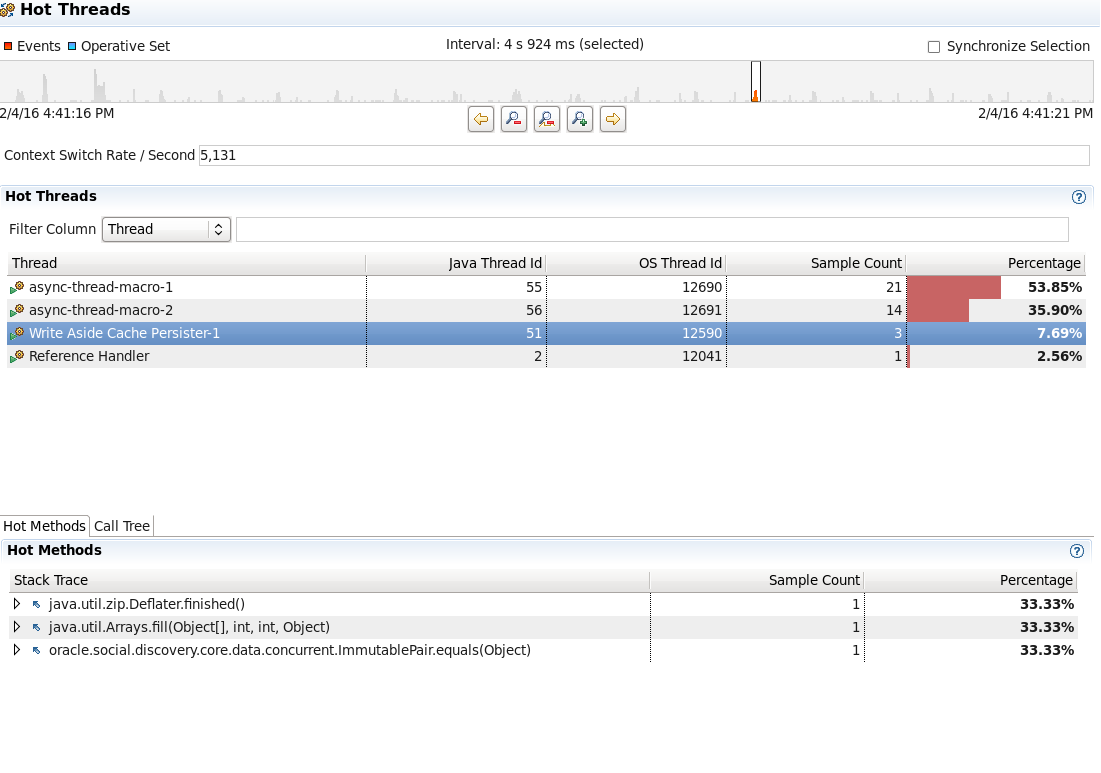
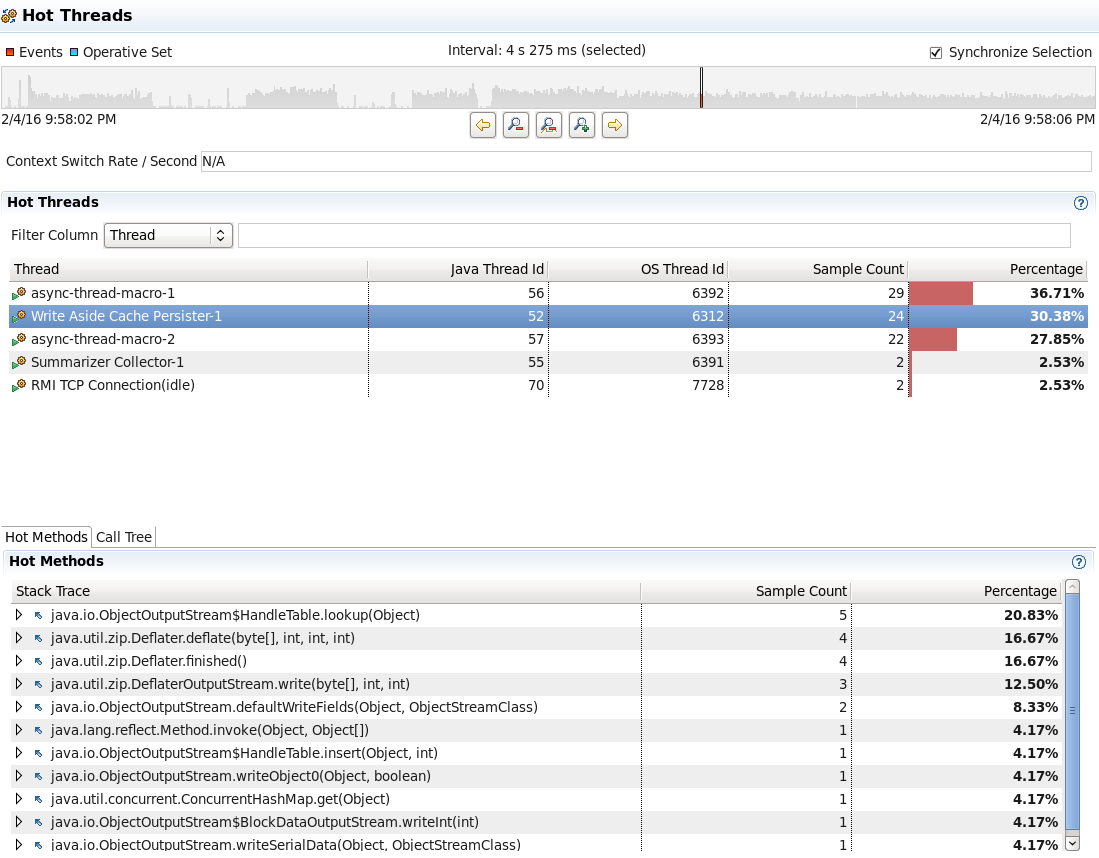
The difference in fidelity is hard to demonstrate, but as an example, check out these two traces of the same thread executing similar workloads. The first was taken using normal safepoint profiling. The second was taken with the non-safepoint profiling flag. Notice that we get a lot more samples, and a more detailed picture of where in the code we are spending our time. In particular, note how in the safepoint profile, we only get three samples of the process of serializing, compressing and streaming taking place in the Write Aside Cache Persister thread, during 4 seconds of execution. In the non-safepoint profile, this is broken down into much more detail with 24 samples in 4 seconds, showing how the time is attributed to different phases of the process. If we were interested in optimizing, we might use this information to dig into what’s happening during java.io.ObjectOutputStream$HandleTable.lookup(), which is not visible in the safepoint profile.
More importantly, note that in the safepoint profile, this thread is shown as accounting for only 7.69% of execution time, whereas in the non-safepoint profile, it is accounting for 30%. This is not just a difference in where I took the samples. I get similar results moving the window around to different time intervals. The reason for the difference is that there are few safepoints in this code path, so there are simply fewer samples that can be taken during this period of time. This gives us a much different picture of the resource usage of this thread.